 SpreadGuide
See where the walls are. Know what your spread is worth.
SpreadGuide is a map for options traders. It puts the GEX levels and the spread pricing on one screen, so you can plan around the walls with the stop already worked out.
iPhone · iOS 18 or later · Context, not advice
Swipe for more screens · simulated demo market
The levels and the price, on one screen.
Planning a spread usually takes two tools. One prices the trade but has no idea where dealer gamma sits. The other maps the walls and the regime but can't tell you what a spread is worth if price gets there. So you copy strikes between tabs and do the rest in your head.
Pricing without levels
A payoff chart shows what the spread does as price moves, but every strike looks the same. Nothing marks where open interest is stacked.
Levels without pricing
A gamma profile shows the walls and the regime, then stops. It can't price a spread at those walls on a given day.
SpreadGuide shows both
The walls sit on the strike ruler and on the P&L chart, so every price, date and level you look at comes with a spread value.
“What is this spread worth if price reaches that wall on Thursday, and where is the stop?”
Read the levels. Plan around the walls.
Four tabs, one loop. SpreadGuide gives you the context; the decisions stay yours.
Read the day
Regime, zero gamma, expected range and which walls held, moved or are new.
02 · BUILDPrice a spread
Pick strikes on the GEX ruler, then see its value over price and time.
03 · IDEASCompare by rules
Spreads placed around the walls by fixed rules, each with checks and a stop.
04 · WATCHLISTKeep watch
Your tickers with their GEX profiles, and the spreads you follow.
Everything on the map, priced.
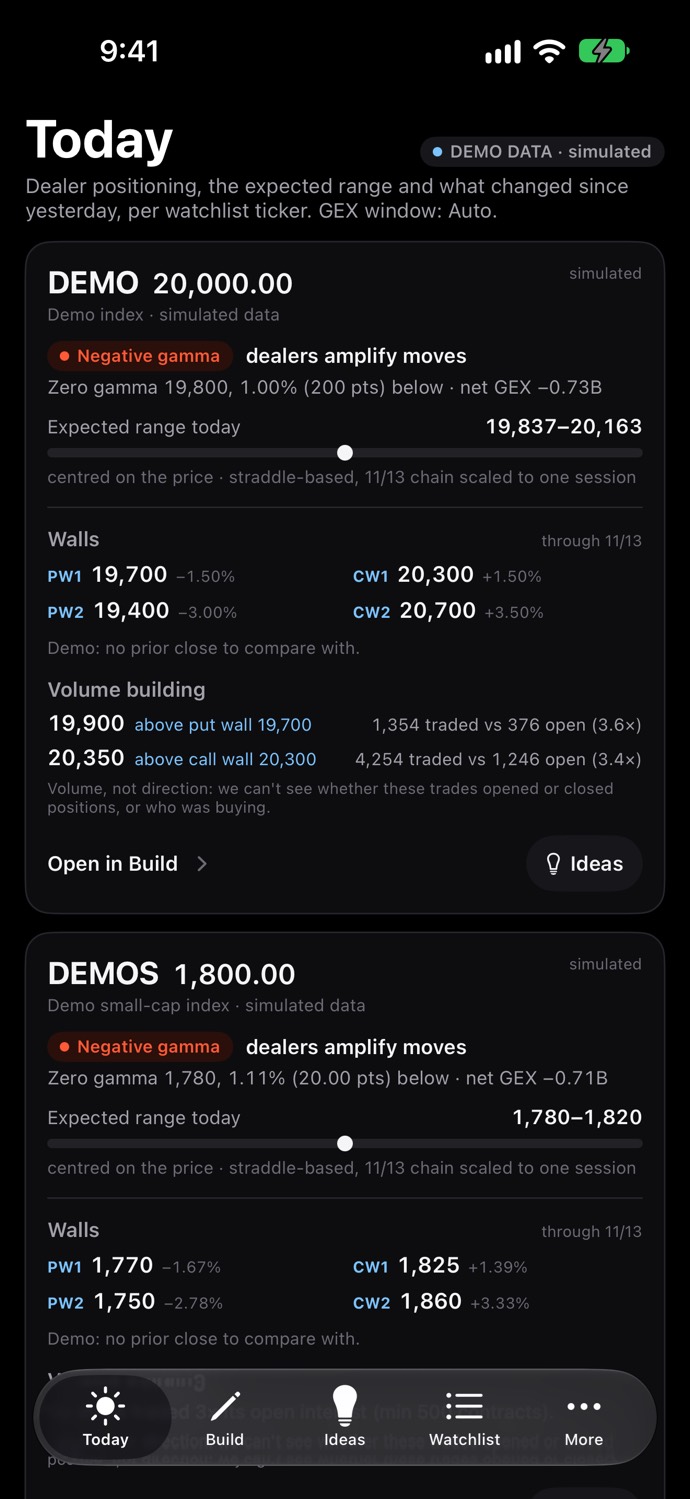
A briefing for every ticker on your watchlist.
One card per ticker, with what changed since yesterday.
- The gamma regime, and how far price is from zero gamma
- The expected range for the session
- Put and call walls, marked held, moved or new versus yesterday
- Where volume is building against open interest
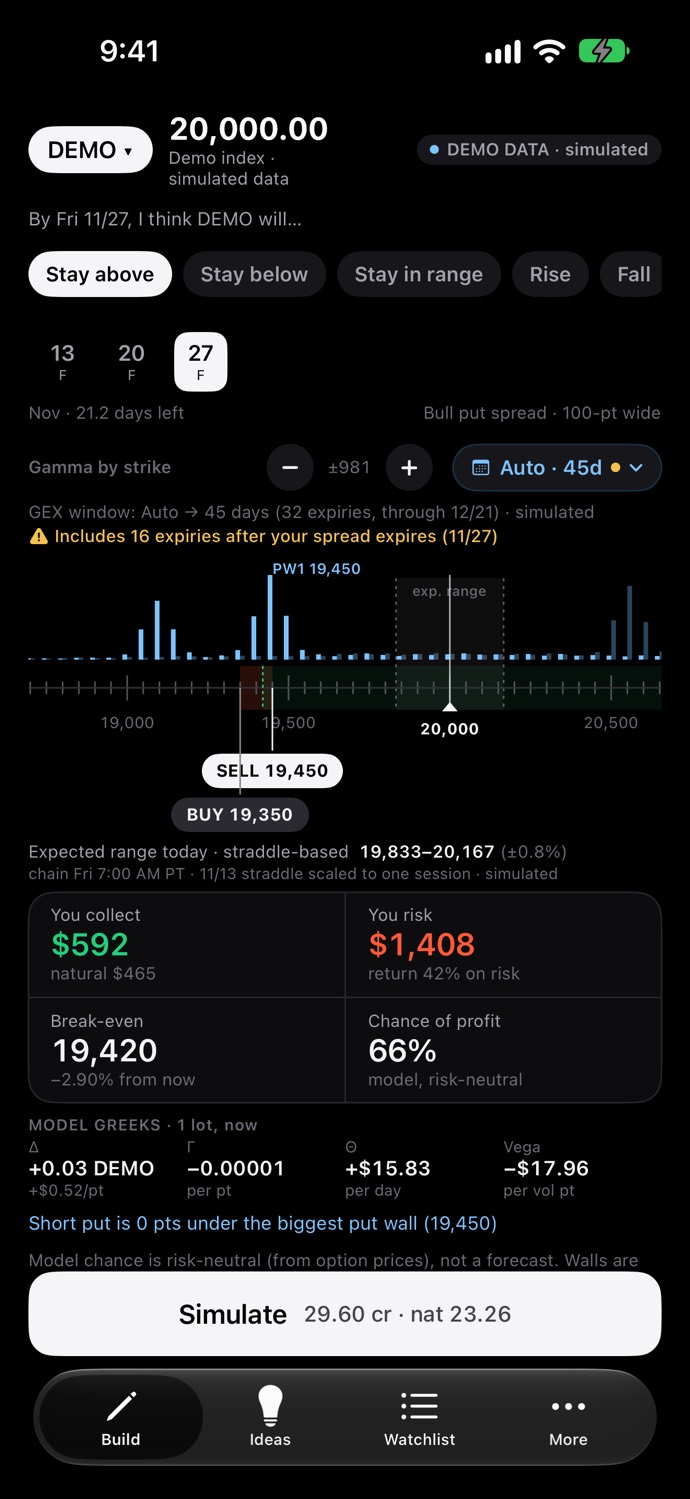
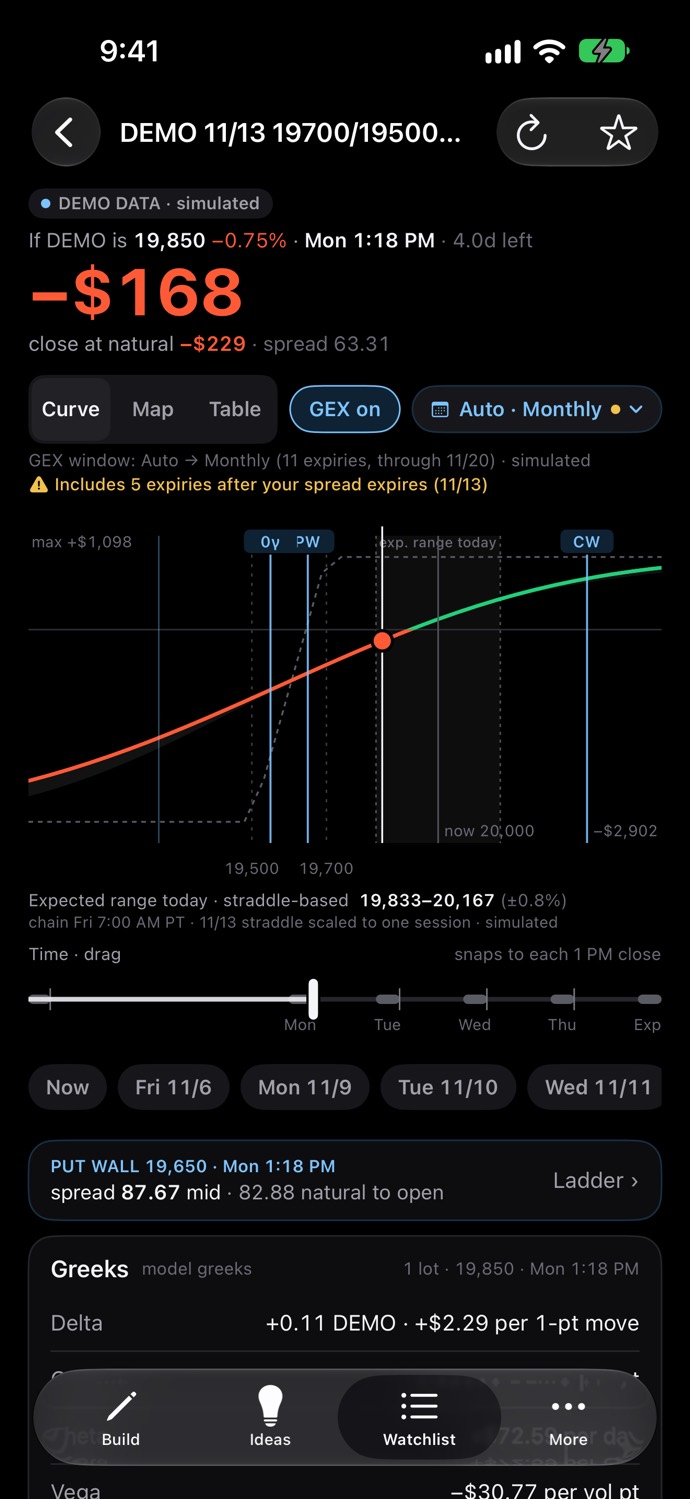
Price a spread against the walls.
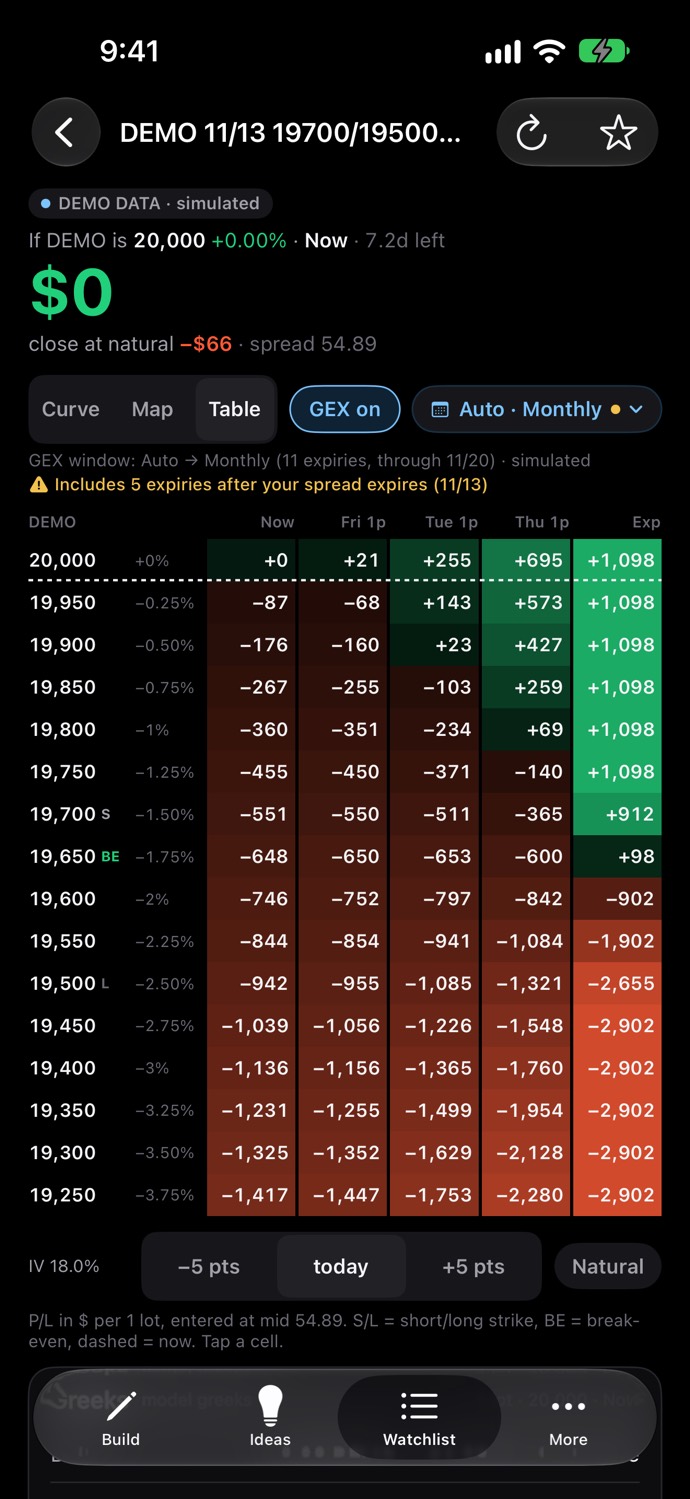
Pick strikes on a ruler with the GEX profile drawn on it, then simulate the spread.
- P&L over price and time, with the walls on the chart
- A limit ladder from the mid to the natural price
- Model greeks, break-even and the expected range
- A table of the spread's value at every price and day
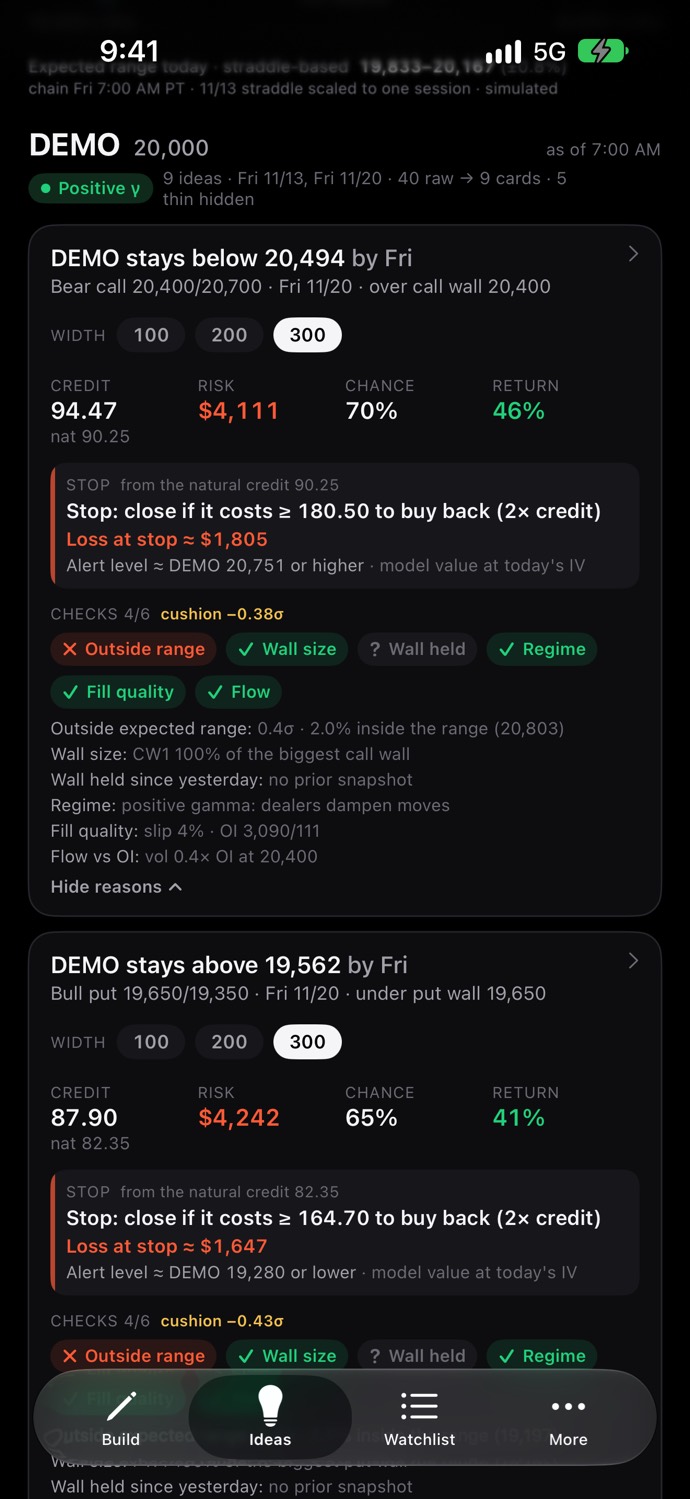
Spreads placed by fixed rules, with a stop.
Ideas places credit spreads around the GEX walls using the same fixed rules every day. It shows what the rules produce; you decide what, if anything, to do with it.
- Duplicates removed, so each card is a different spread
- Every check the card passes or fails, with the reason
- A stop level on every card, set at 2× the credit
Your tickers and spreads, in one list.
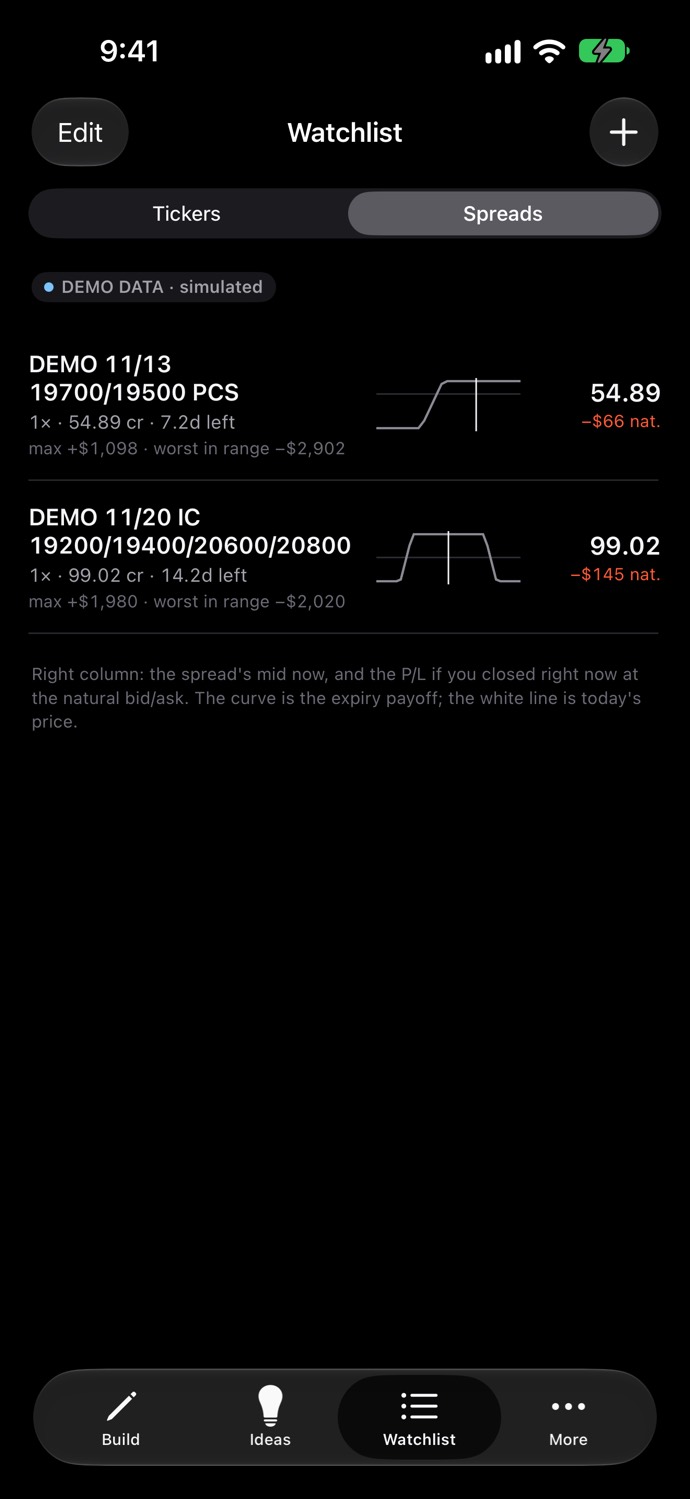
Keep the tickers you trade with their GEX profiles: net gamma, the walls and their size, and the expected range. Save spreads to follow their value at the mid and at the natural price.
All screenshots show SpreadGuide's built-in demo market: simulated prices, not real market data.
We test our own levels.
Walls are a way to organize a chart, not a promise about what price will do. So every week SpreadGuide checks its own wall rule against what happened, and publishes the result in the app, whether or not it flatters us.
The sample is still small and covers a single market regime, and the scorecard says so next to the result.
Free to plan. Pro for the whole watchlist.
Pro unlocks features, never data: Free and Pro see the same prices and levels. Risk information, like the stop level on every idea, is never behind the paywall.
- Build and simulate every strategy, one ticker at a time
- P&L curve with the GEX overlay, and the strike ruler with GEX
- Today for your first watchlist ticker, and the weekly wall scorecard
- Ideas for one ticker, the first two cards per expiry
- The stop level on every card
- Watchlist of up to 3 tickers, and the demo market
- Today for your whole watchlist
- Ideas across the watchlist, every card, all filters and sorts
- GEX ladder, since-yesterday and positioning views, and the GEX window picker
- Simulate's Map and Table views, with an IV what-if
- Model greeks and the expected range on the Build ruler
- Unlimited watchlist tickers
Planned launch prices in US dollars; they may change before release and are set in the App Store. The 7-day free trial applies to the annual plan. Subscriptions are billed by Apple, renew automatically and can be cancelled in iOS Settings. There's nothing to pay during the invite-only TestFlight beta.
Questions, answered.
Where does the market data come from?
For the public launch, option chains and gamma levels will come from a licensed market-data provider. Before release we'll name it here and say whether quotes are real-time or delayed.
During the beta, invited testers connect to a private data server, and everyone can use the built-in demo market: a simulated option chain generated on your iPhone, labelled “Demo data” on every screen. Each screen shows where its data came from and how old it is.
GEX levels are an estimate of dealer positioning built from open interest. Nobody publishes dealers' actual books, so treat walls as an approximate map.
Is this investment advice?
No. SpreadGuide is an educational tool. It shows you where the levels are and what a spread is worth at each level, using model estimates. It doesn't predict direction and doesn't tell you what to trade.
Ideas are spreads produced by a fixed placement rule, explained in the app and shown with the checks each one passes or fails. They are a starting point for your own analysis, not advice. Context, not advice: what you trade, if anything, is your decision.
How accurate are the prices?
Every value is a model estimate: implied volatility is fitted to the quoted chain and options are priced with a Black-76 model. SpreadGuide shows both the mid and the natural price, the one on the far side of each leg's bid/ask, because real fills differ from the mid. We haven't published a model-vs-market error study yet, so treat every number as an estimate.
Is it iPhone only?
Yes. SpreadGuide is an iPhone app for iOS 18 or later. There's no Android, iPad or web version yet.
How do I get into the beta?
The beta is invite-only, through Apple's TestFlight. Join the waitlist below and we'll email you when a spot opens. Invites go out in small batches.
Does it connect to my broker or place trades?
No. SpreadGuide has no order routing and doesn't connect to any brokerage account. It can't see your positions or balances. It only simulates.
What happens to my email?
We use it to invite you to the beta and to tell you when SpreadGuide launches. We don't sell or share it, and there are no trackers on this site. Ask us to remove it any time at support@spreadguide.com. Details are in the privacy policy.
Get on the map early.
Leave your email and we'll send a TestFlight invite when a spot opens. iPhone only.